Reason to trust
Strict editorial policy that focuses on accuracy, relevance, and impartiality
Created by industry experts and meticulously reviewed
The highest standards in reporting and publishing
Strict editorial policy that focuses on accuracy, relevance, and impartiality
Morbi pretium leo et nisl aliquam mollis. Quisque arcu lorem, ultricies quis pellentesque nec, ullamcorper eu odio.
BitMine chairman Tom Lee has pinned Ethereum’s long-run upside to an explicit ratio framework and a “replacement-cost” lens on global payment rails. In his September 2 “Chairman’s Message,” the Fundstrat co-founder centers the analysis on the ETH/BTC cross and a year-end Bitcoin anchor of $250,000, using a slide-based grid to translate ratio levels into ETH spot targets—and then extends the calculus to a $62,500 scenario if Wall Street’s settlement stack migrates to Ethereum.
Why Ethereum Could Soar To $62,500
“The 8-year average Ethereum to Bitcoin ratio is 0.04790 and it’s currently 0.0432, meaning we’re below the long-term average. The all-time high in this ratio was 0.0873,” Lee says. “Of course, it started off higher, but I’m talking about the 2021 all-time high. So, we think that not only should Ethereum recover to the long-term average, it should probably get to the all-time high ratio and arguably exceed it as we start talking about Ethereum acting as the chain for both Wall Street to build its payment rails and the financial system as well as AI.”
Related Reading
He then walks through the core exhibit. “So, let’s think about what that means for price. I have a grid here. On the left side is Bitcoin price levels and then going across are various levels of the Ethereum to Bitcoin ratio. Our year-end target—this is from the Fundstrat side—for Bitcoin is $250,000. And if you look at the average, okay, then you can see the range of prices for Ethereum using this ratio and different levels of Bitcoin. And here’s the 2021 high. And as you can see, at a $250,000 Bitcoin, you get to somewhere between $12,000 and $22,000 value per Ethereum token.”
The slide shows: if BTC runs to $250K and ETH just trades at the average ratio, it implies ~$12,000; if ETH recovers its 2021 ratio high of ~0.087, that jumps closer to ~$22,000. “But that’s just a ratio recovery,” Lee continues. “If you look at the replacement cost of payment rails and the banking system, that gets you to an implied value of Ethereum of around $60,000. And that puts the ratio at roughly 0.250 Ethereum to Bitcoin ratio. And as you can see, that’s how you get to $62,500 per Ethereum token. So plenty of upside.”

Lee frames this ratio-first math within a broader structural thesis that Ethereum is entering a “1971 moment” for finance, as real-world assets are synthesized into on-chain instruments and stablecoins expand as digital base money. The near-term numerical anchor is the 0.0432 ETH/BTC print sitting below the 0.04790 eight-year mean; the medium-term objective is a reversion toward, and potentially beyond, the 2021 high he cites. The grid translates those waypoints into discrete ETH prices at a fixed Bitcoin reference, which is why Lee emphasizes both variables in tandem rather than an ETH-only trajectory.
Related Reading
Beyond the grid, Lee argues that Ethereum captures the greatest share of tokenized financial activity and that its proof-of-stake economics align with how regulated institutions pay for security and uptime today. In his telling, banks and market operators already fund siloed infrastructure stacks; staking ETH to secure common rails could substitute that spend while returning a native yield, an incentive he says pushes the ETH/BTC ratio higher as risk capital and cash flows migrate.
This is also where the “replacement-cost” view feeds into the $62,500 outcome: if Ethereum becomes the settlement substrate for payment networks, tokenized credit and equity, and AI-linked data rights, the market should price ETH on the value of the rails it replaces rather than only on historical multiples or cycle heuristics.
The message also situates BitMine’s corporate blueprint inside that macro arc. Lee describes BitMine as an Ethereum treasury business built to compound ETH per share through five levers—equity issued above NAV, equity-linked volatility monetization, operating cash flows, staking rewards, and M&A for treasuries near NAV—arguing that proof-of-stake turns an ETH balance sheet into an income-producing infrastructure asset.
Lee’s math makes the dependencies explicit: a Bitcoin anchor around $250,000 and an ETH/BTC advance first to the long-term average (~0.048), then toward the 2021 peak (~0.0873), and, in the replacement-cost scenario, to ~0.25. The first two steps imply ~$12,000–$22,000 ETH on his grid; the third defines the $62,500 “skyrocket” case tied to financial-plumbing migration and AI-era settlement on Ethereum. As he puts it: “That’s how you get to $62,500 per Ethereum token.”
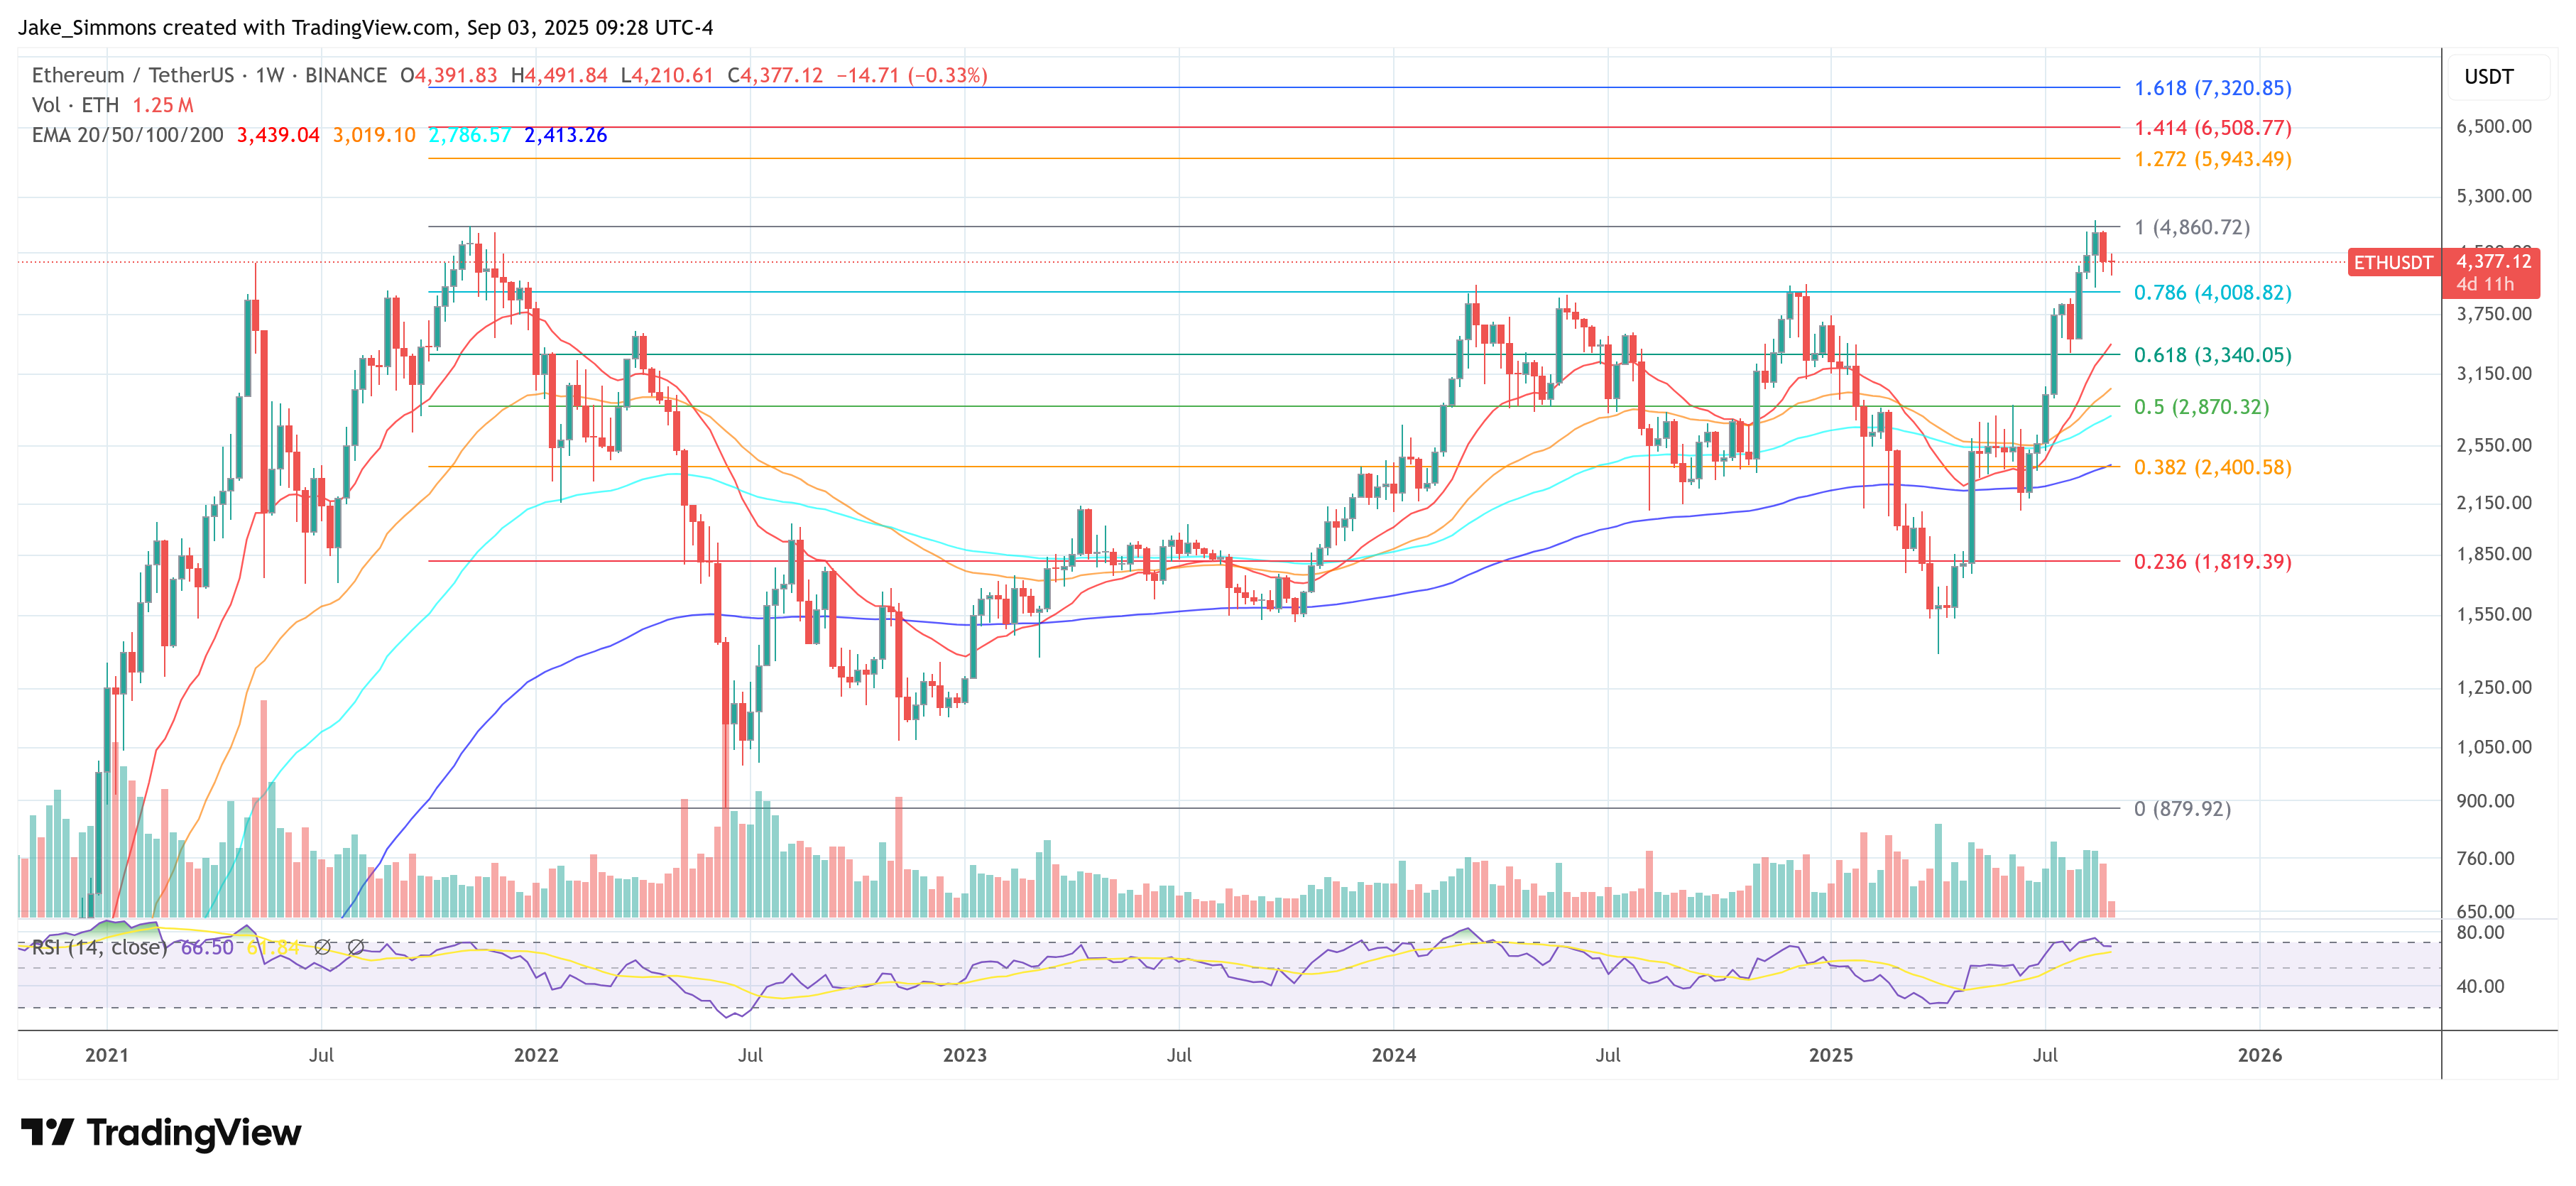
At press time, ETH traded at $4,377.

Featured image created with DALL.E, chart from TradingView.com
Source link
Jake Simmons
https://www.newsbtc.com/news/ethereum/ethereum-skyrocket-math-tom-lee-62500/
2025-09-04 01:00:00


