There’s a lot of chatter around Ethereum price; will it break $4,000, or is another collapse brewing? The bears seem to be winning this round. Over the last 7 days, the ETH price has shed more than 8.6% and currently trades around $3,533, still 27.1% off its all-time high.
But beneath the surface, the data paints a different picture: one where the smart money may have already set the trap. Three clear signals and a bullish pattern suggest Ethereum’s recent breakdowns might be nothing more than an orchestrated bear trap.
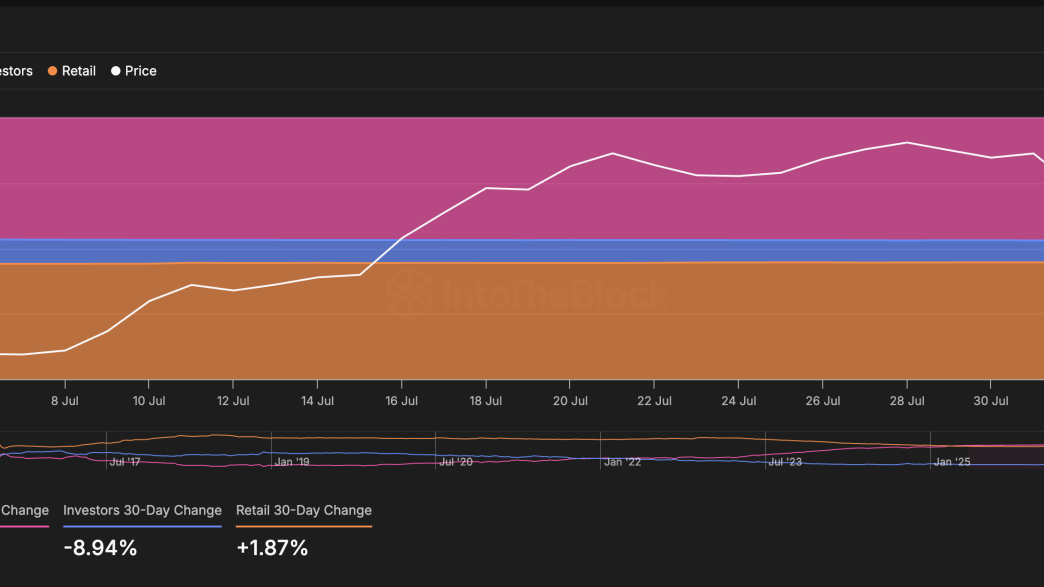
Whale and Retail Concentration Flip Bullish
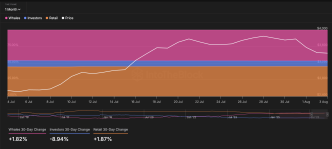
The first signal comes from Ethereum’s on-chain concentration metrics. Over the last 30 days, whale holdings have risen by 1.82%, while retail wallets (small holders) have increased exposure by 1.87%. In most cases, whale moves end up outweighing investor and retail movements due to the sheer size of trading.
And this time, it seems that retail is following the ETH whales, possibly leaving investors or mid-size folks in a trap of sorts.
Interestingly, mid-size investor wallets have offloaded, potentially hinting at redistribution toward the extremes; whales and retail, two groups known for having very different motives, but both seem confident here.
Adding weight to this view is IntoTheBlock’s Bull vs Bear address chart, which doesn’t use typical sentiment metrics. Instead, it tracks wallet behavior: bulls are those that have bought over 1% of daily traded volume, while bears have sold at least 1%.
Over the last 7 days, bulls outnumber bears by 7: a slim edge, but enough to suggest conviction is leaning toward accumulation, not distribution.
For token TA and market updates: Want more token insights like this? Sign up for Editor Harsh Notariya’s Daily Crypto Newsletter here.
Long/Short Account Ratio Shows Traders Leaning Bullish
Despite the sideways action and frequent dips, traders haven’t flipped bearish yet. According to Binance’s long-short account ratio, Ethereum’s metric currently stands at 1.91, meaning there are nearly twice as many long accounts as short ones.
It’s important to note: this isn’t the same as the long/short position volume ratio. The account ratio measures the number of user accounts holding long vs. short positions, not just trade size.
This data, taken over the past 24 hours, suggests that more traders expect upside continuation, even as the price chops around near key resistance. Historically, similar ratios have held just before major directional moves.
Bullish Triangle Still Intact After Testing Key Ethereum Price Support
The most visually telling part of the Ethereum price structure is its bullish (ascending) triangle pattern on the daily chart. After an explosive move from the $2,120 low to $3,939, Ethereum entered a tight consolidation range. The 0.236 Fibonacci trend extension level, or the $3,785 price level, tried offering support but was quickly broken.
A long red candle followed, corresponding to the timeframe when ETH short positions took center stage. Even ETH selling intensified post the drop, with traders supposedly assuming that even the $3,356 support would be broken. And guess what, that support line was tested briefly.
The line was tested yesterday, aligning with the Smart Trader opening a short position. But then, the price rebounded, and would have already liquidated the trader. One bear trapped!
It won’t be wrong to assume that many similar short positions were opened.
However, if the daily candle closes above $3,785, ETH price might just have the legs to test $3,939 and then $4,051, with the move to the latter qualifying as a clean breakout.
But then, if the key support of $3,356 is ultimately broken, the bullish hypothesis gets invalidated
The post Did Ethereum Just Trap the Bears? 3 Signals Suggest It Might Have appeared first on BeInCrypto.
Source link
Ananda Banerjee
https://beincrypto.com/ethereum-price-breakout-signals/
2025-08-05 00:00:00


