


As Bitcoin (BTC) stalls near the $113,000 level, Ethereum (ETH) continues to show strength, highlighting a clear divergence in price action between the top two cryptocurrencies by market cap. This contrast has some investors considering a rotation from BTC into ETH to capture the latter’s bullish momentum.
Bitcoin Shows Correction Risks – Is ETH Safe?
According to a CryptoQuant Quicktake post by contributor XWIN Research Japan, on-chain data reveals underlying weakness in BTC price action. By contrast, ETH is displaying notable resilience even as broader crypto market momentum fades.
Related Reading
Currently, Bitcoin’s exchange reserves are hovering around 2.53 million BTC, showing little sign of declining despite recent volatility. For context, BTC has fallen 5.4% over the past week.
Historically, shrinking exchange reserves have indicated BTC moving off exchanges for long-term holding, which reduces near-term sell pressure. This time, however, reserves remain flat, suggesting that a significant portion of BTC supply is still liquid and available for selling.
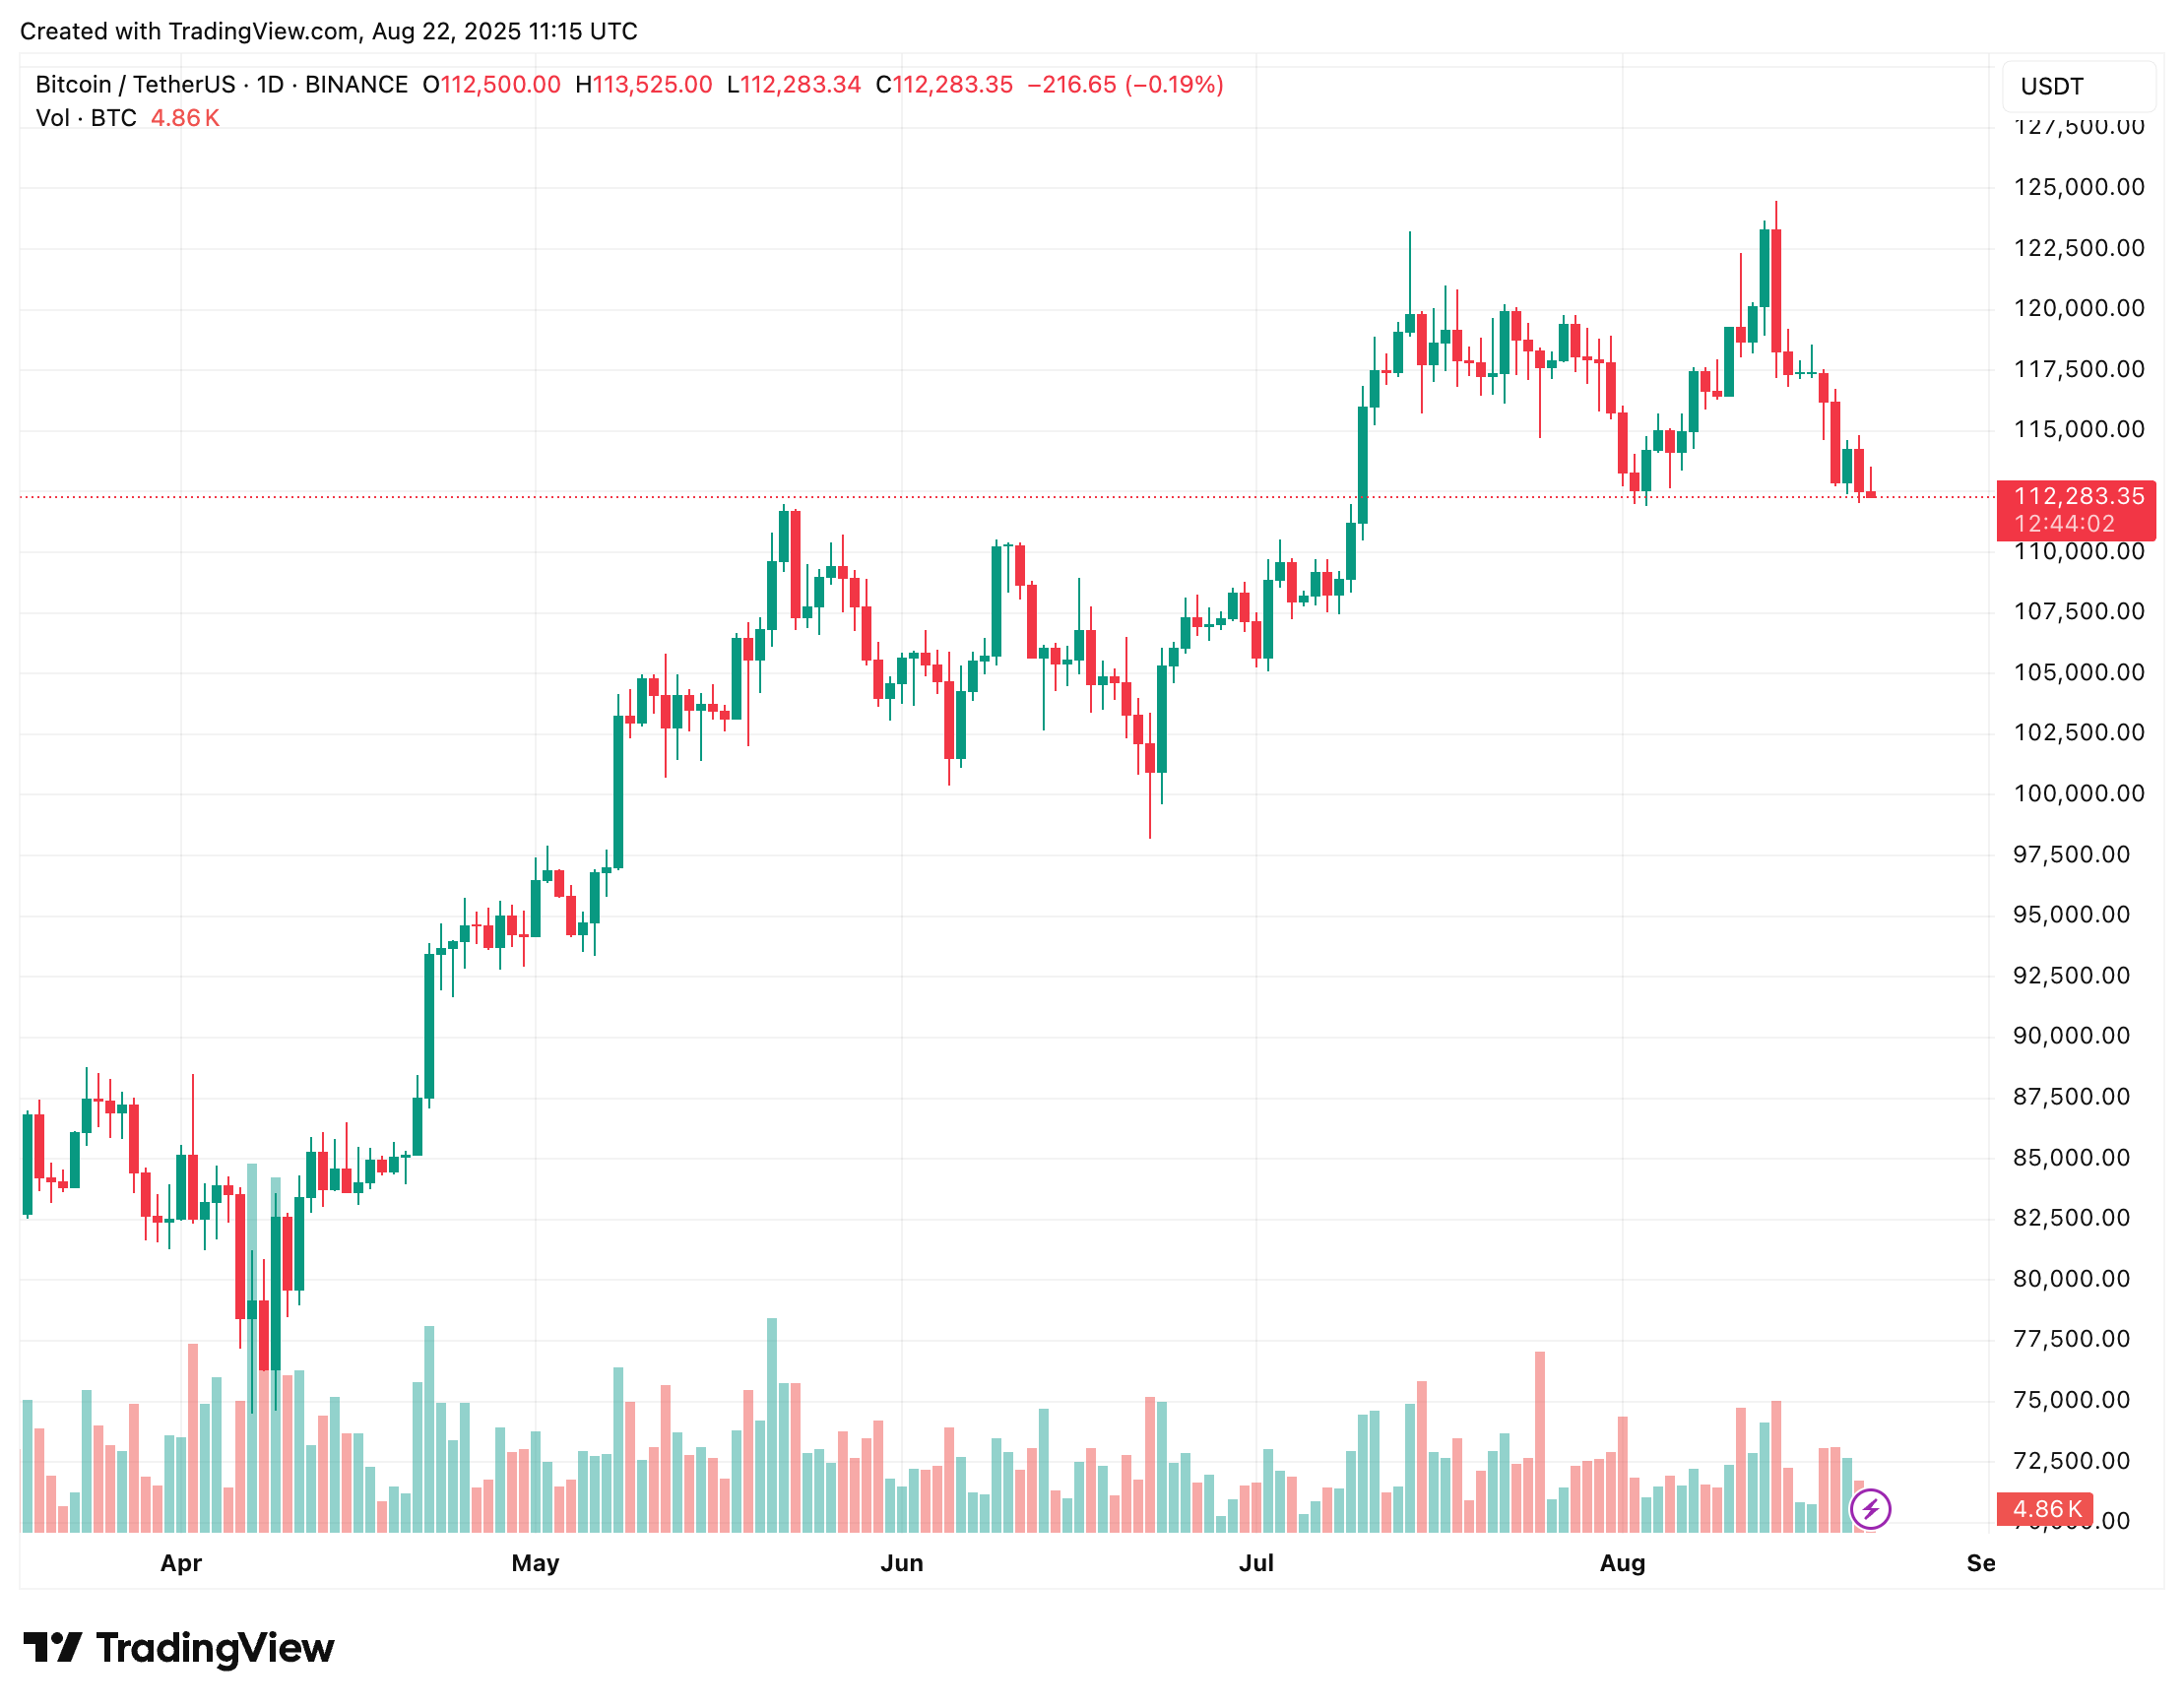
Flat exchange reserves – combined with BTC’s recent drop from $123,000 to $113,000 – have raised red flags for a possible short-term correction. Meanwhile, ETH’s on-chain dynamics tell a very different story.
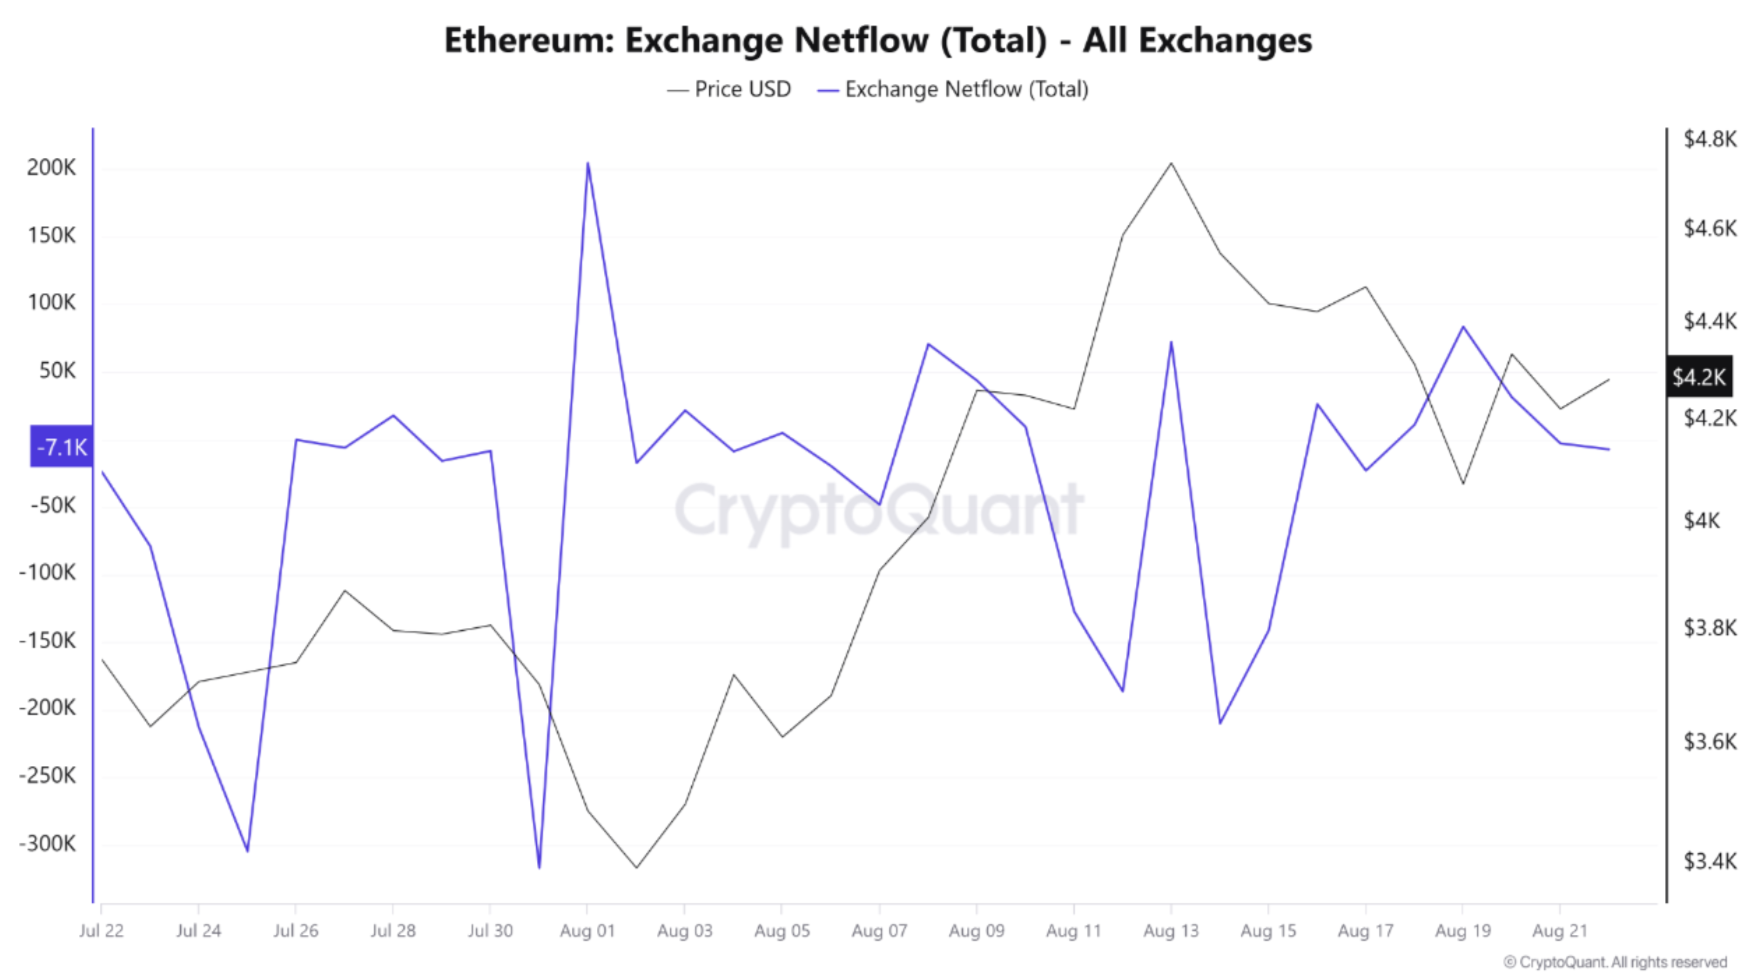
Unlike BTC, ETH has consistently recorded large net outflows from exchanges, with multiple spikes exceeding 300,000 ETH in late July and mid-August. XWIN Research Japan explained:
Outflows usually reflect coins moving into cold storage, staking, or institutional custody, tightening the available supply on the open market. ETH’s price has been between $4.150 to $4,400, aligning with the outflow trend and reinforcing a bullish narrative of a potential supply shock.
In short, while BTC is consolidating with lingering sell-side liquidity, ETH’s declining exchange balances signal rising institutional demand. These opposing dynamics suggest capital may be rotating from BTC to ETH.
Different Dynamics Between BTC And ETH
Beyond exchange reserves, other indicators also highlight further downside risk for BTC and growing institutional interest in ETH, reinforcing the market’s preference for Ethereum over Bitcoin.
Related Reading
For instance, noted crypto analyst Xanrox recently offered a dramatic price prediction for BTC, stating that it may crash all the way down to $60,000 – almost a 50% fall from its current market price.
Meanwhile, whales continue to increase their exposure to ETH, growing their holdings at a rapid pace as ETH’s relative strength compared to BTC improves. Yesterday, an Ethereum whale went long on $300 million worth of ETH on-chain.
From a technical perspective as well, things look positive for ETH, with a potential recovery to $4,788 on the cards. At press time, BTC trades at $112,283, down 0.7% in the past 24 hours.
Featured image from Unsplash, charts from CryptoQuant and TradingView.com
Source link
Ash Tiwari
https://www.newsbtc.com/bitcoin-news/bitcoin-ethereum-strength-on-chain-data/
2025-08-22 22:00:00


