


Ethereum’s price is very close to making a new high in 2025, following Bitcoin’s recent record-breaking run. However, there are some signs of caution, as the market might be overheated, as momentum indicators suggest. Therefore, while the market structure is still bullish, this might not be a good time to buy ETH due to its riskiness.
Technical Analysis
By ShayanMarkets
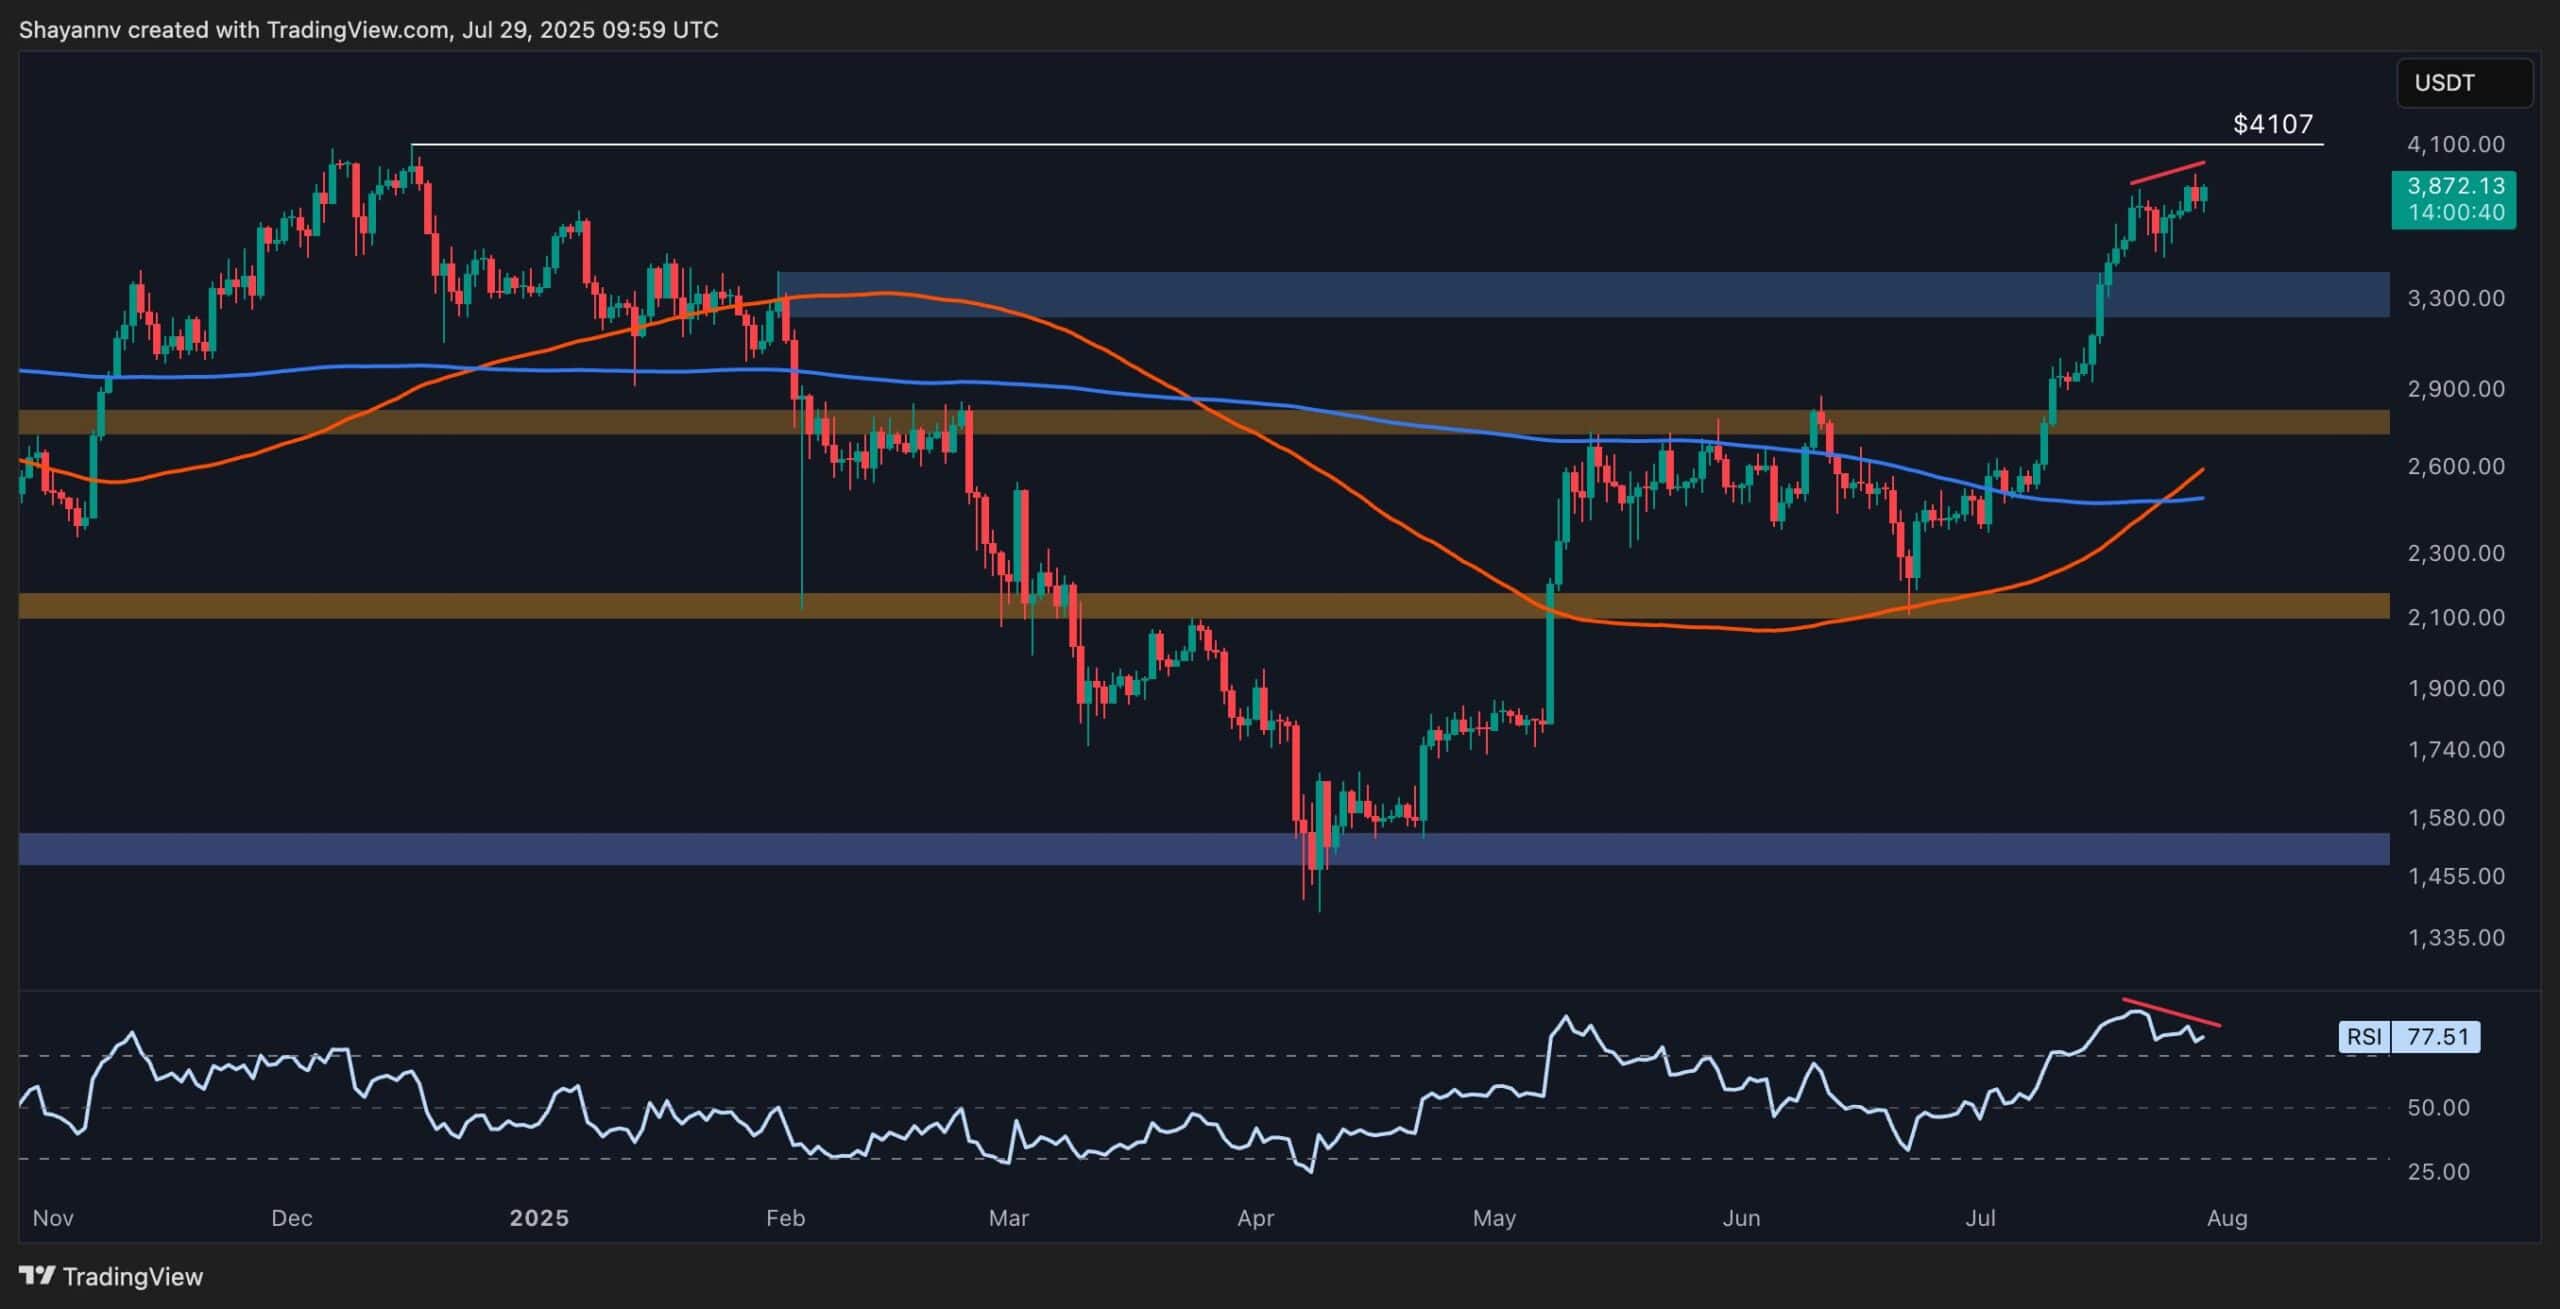
The Daily Chart
As the daily chart shows, ETH’s price has been rallying aggressively since its rebound from the $2,100 support level. It has since broken above both the 100-day and 200-day moving averages. These daily MAs, located around the $2,600 mark, have created a bullish crossover, further solidifying the bullish structure of the market.
However, there are some reasons for concern. As evident, the RSI indicator has been in the overbought region for a while now, and is also demonstrating a clear bearish divergence with the price’s recent highs. In this case, a pullback to the $3,300 support zone could precede a potential breakout above the previous high around $4,107.
The 4-Hour Chart
Zooming in on the 4-hour chart, an interesting price action pattern is forming just below the key $4,000 resistance level. The ascending channel currently trapping the price inside is mostly a reversal pattern if broken to the downside. Therefore, the lower boundary of the channel, located around the $3,500 short-term support level, is now the most critical area the buyers should defend.
On the other hand, a breakout above the pattern could initiate a significant rally, as it would go against technical expectations. Therefore, investors should watch out for a potentially explosive run if the channel gets broken to the upside, as it would mean that the recent consolidation was an accumulation phase, not a distribution by the smart money.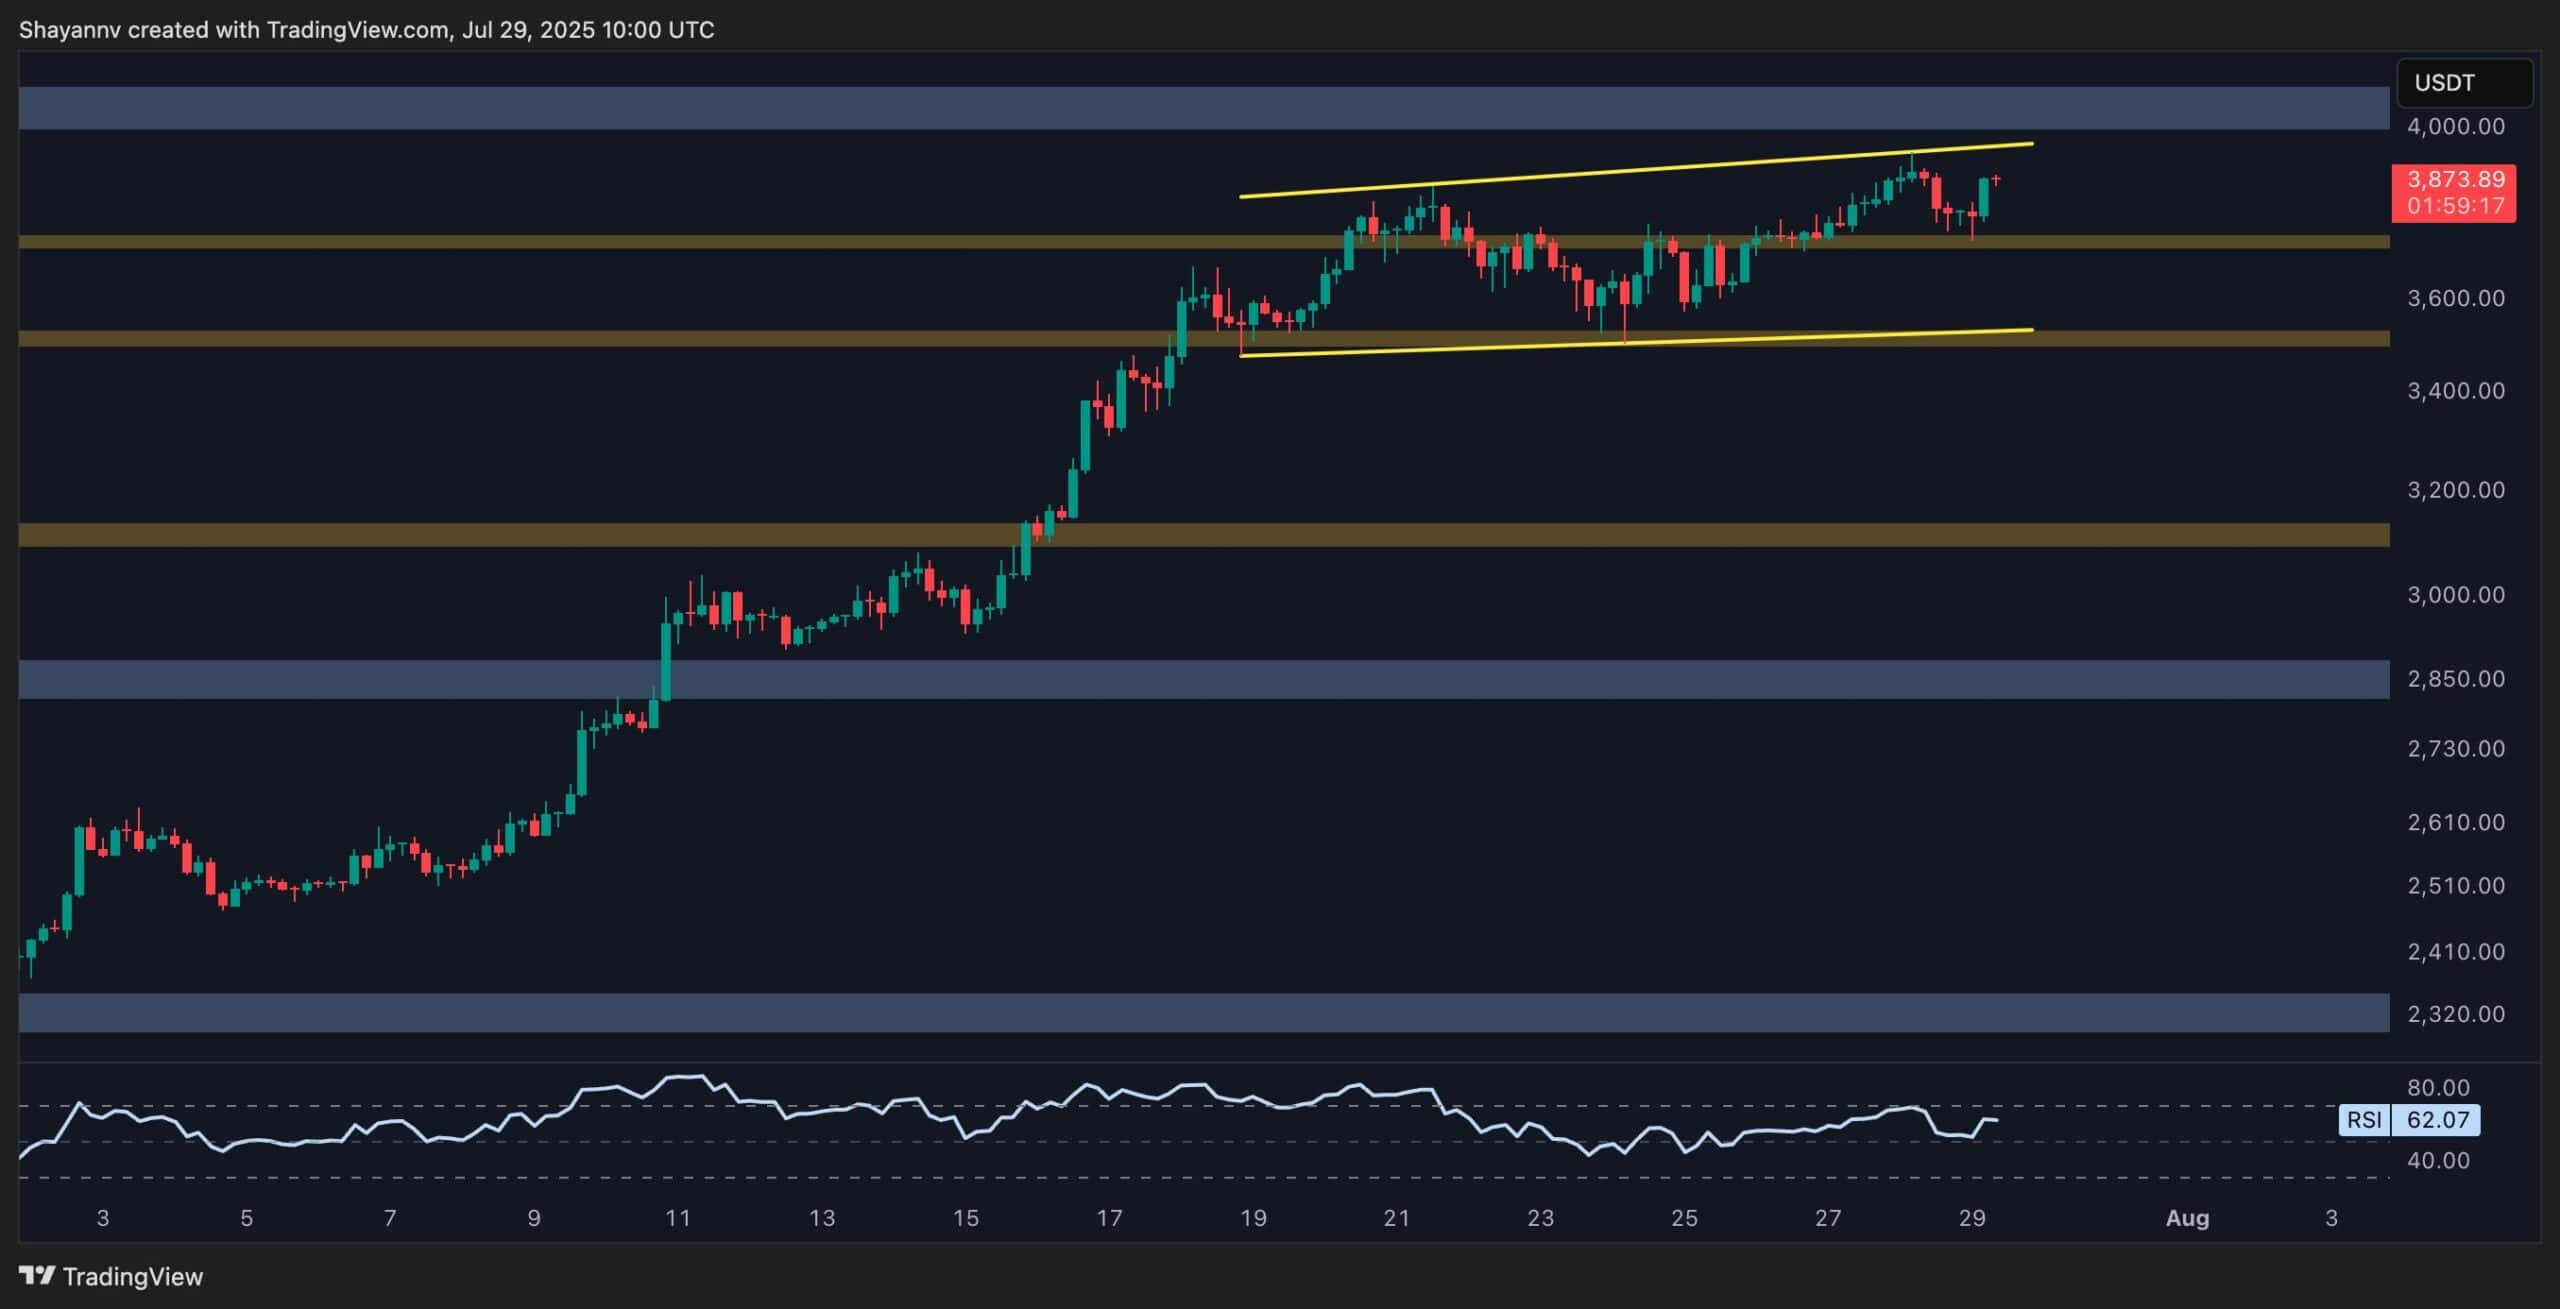
On-Chain Analysis
Ethereum Fund Holdings
The latest data on Ethereum fund holdings shows a sharp and sustained increase, reaching over 5.3 million ETH, marking the highest level ever recorded. This metric reflects the total amount of ETH held by institutions through vehicles like ETFs, trusts, and crypto-focused funds.
The rise suggests growing institutional confidence in Ethereum, likely fueled by its improving price structure, growing narrative around ETH ETFs, and the broader appetite for regulated, indirect exposure to crypto assets. Notably, this surge in holdings has closely followed Ethereum’s breakout above $3,000, reinforcing the idea that institutions are stepping in during periods of strength, not just weakness.
The chart also shows how closely fund holdings align with price trends. When Ethereum sold off sharply earlier this year, fund holdings declined, but they began recovering aggressively alongside the price from May onward. This behavior indicates that institutions are becoming more active in responding to market momentum rather than just accumulating during downturns.
If this trend continues, rising fund holdings could add a steady source of demand and act as a tailwind for Ethereum in the coming weeks, especially as more investors seek exposure through structured, regulated products rather than direct crypto purchases.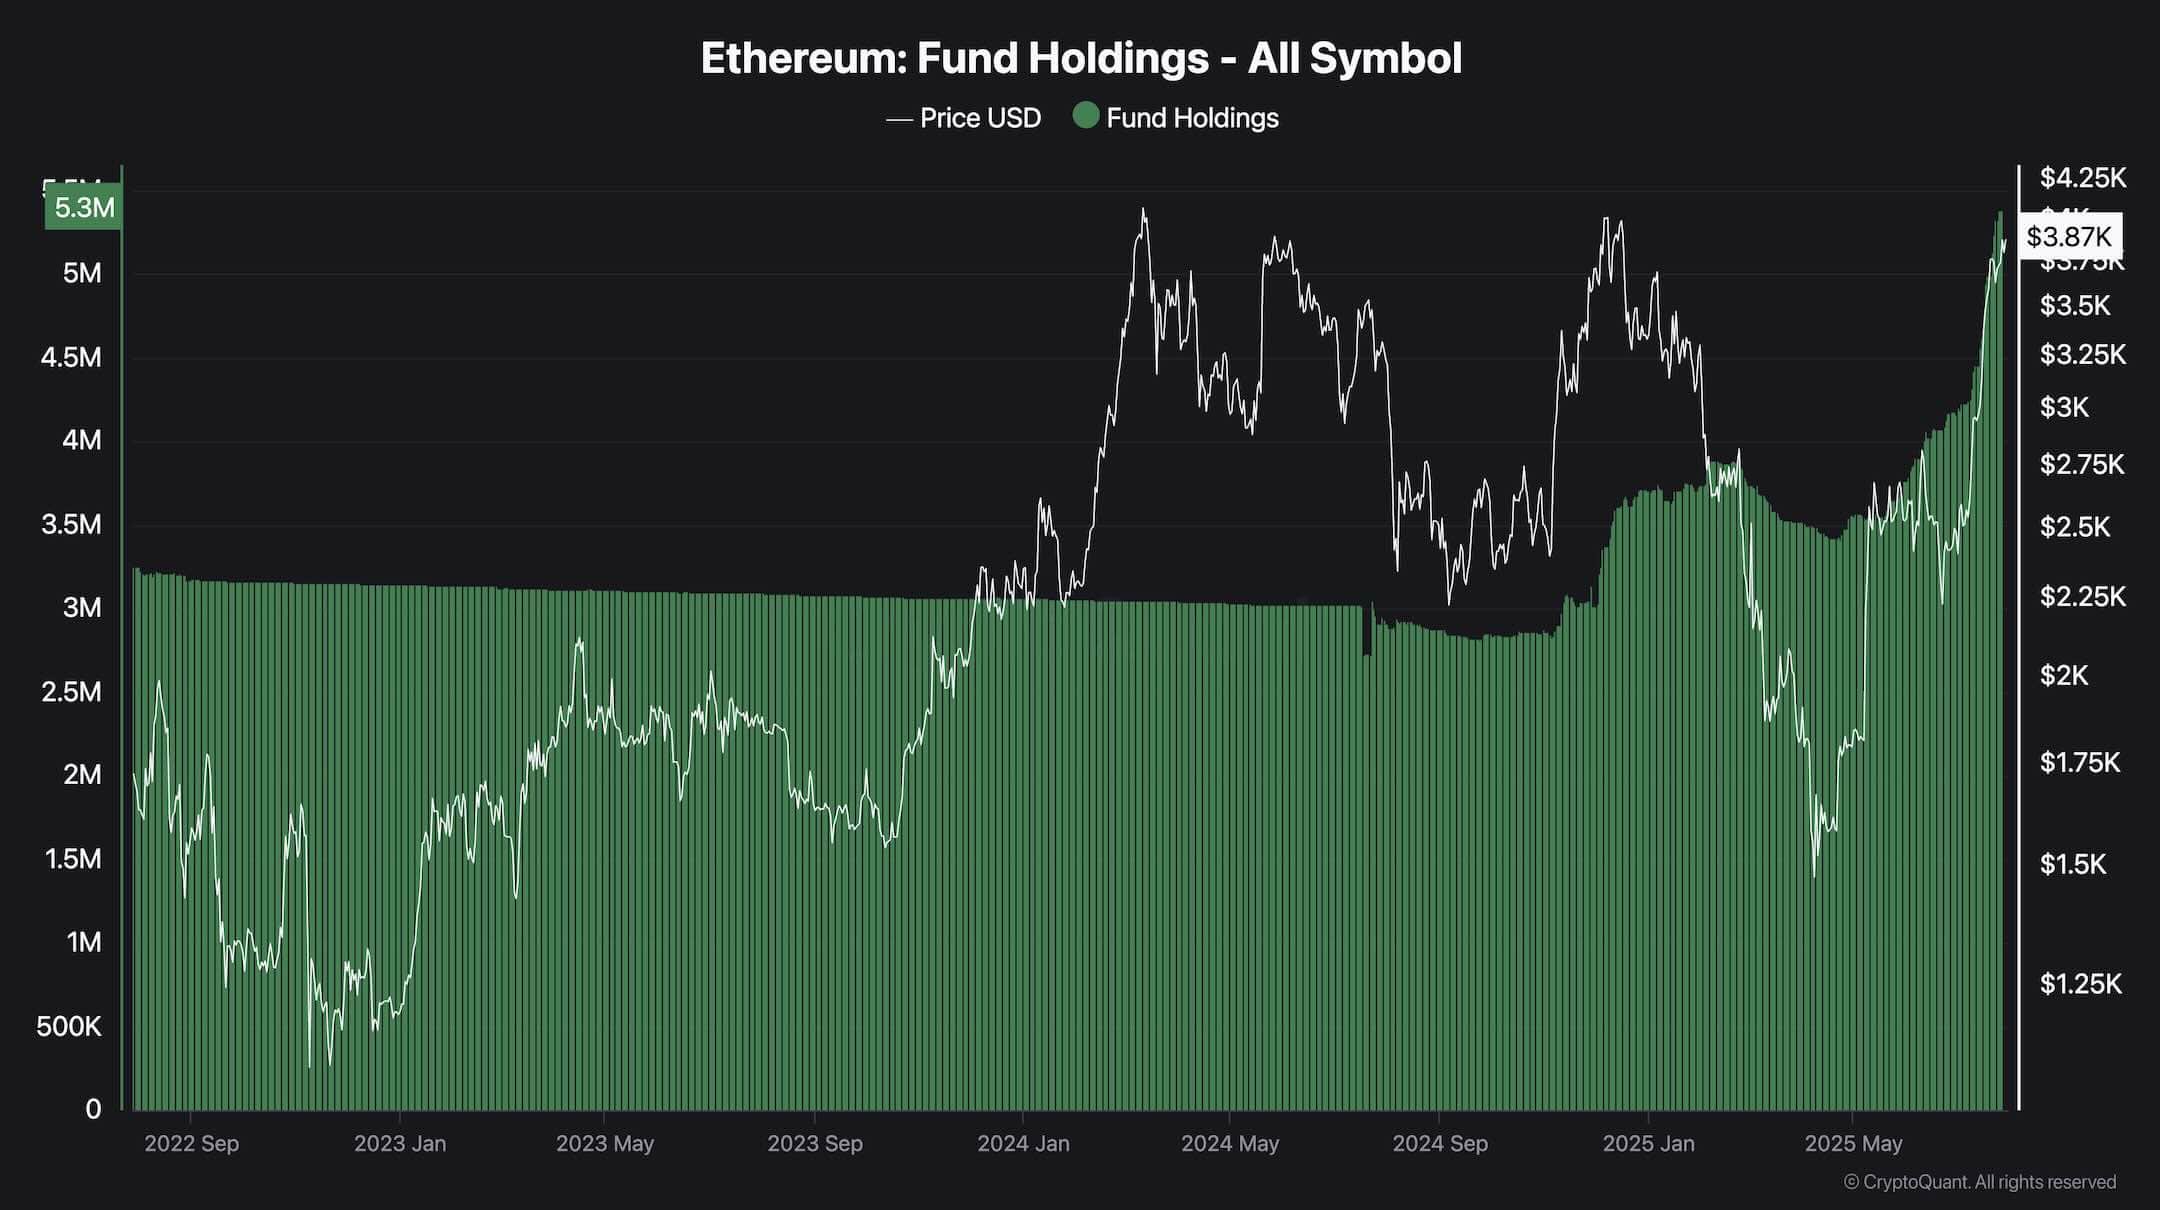
Binance Free $600 (CryptoPotato Exclusive): Use this link to register a new account and receive $600 exclusive welcome offer on Binance (full details).
LIMITED OFFER for CryptoPotato readers at Bybit: Use this link to register and open a $500 FREE position on any coin!
Disclaimer: Information found on CryptoPotato is those of writers quoted. It does not represent the opinions of CryptoPotato on whether to buy, sell, or hold any investments. You are advised to conduct your own research before making any investment decisions. Use provided information at your own risk. See Disclaimer for more information.
Cryptocurrency charts by TradingView.
Source link
CryptoVizArt
https://cryptopotato.com/ethereum-price-analysis-how-close-is-eth-to-breaking-above-4k/
2025-07-29 13:39:17