

Bitcoin is making its first meaningful move since breaking its all-time highs and reaching the $123,000 level. After consolidating in a tight range for nearly two weeks, the price is now pulling back toward $115,000—marking a 6% decline from recent highs. While this retracement has stirred caution among short-term traders, data suggests there is little cause for concern at this stage.
Related Reading
According to CryptoQuant’s Bitcoin Price Drawdown Analysis chart, the current 6% pullback remains well within the normal volatility range observed during prior bull phases. This suggests the move is more likely a healthy market reset than the beginning of a deeper correction.
As Bitcoin tests the lower boundary of its former range, investors will closely watch for renewed strength or signs of distribution. For now, fundamentals and long-term holder data remain supportive, keeping bullish sentiment intact despite short-term volatility. The next few sessions may determine whether BTC can bounce decisively or enter a broader consolidation phase.
Bitcoin Volatility Remains Within Norms As Market Enters Critical Phase
According to top analyst Axel Adler, Bitcoin’s recent price action may appear sharp at first glance, but deeper analysis shows that current volatility remains well within normal historical ranges. Over the past quarter, Bitcoin’s most notable intraday drops on the 5-minute timeframe reached -10% in early June and -12% in mid-June. Meanwhile, the average weekly drawdown, represented by the green line on Adler’s chart, remains stable at 3.8%.
The current -6% pullback—following Bitcoin’s recent breakout to $123K and its retrace toward $115K—sits only 2.2% deeper than this weekly average and is still far from the panic-triggering extremes seen in previous months. Despite the dramatic visual appearance, Adler emphasizes that the current correction aligns with a standard consolidation cycle often seen during bull markets.
What makes this moment especially relevant is how other parts of the crypto market are behaving. While altcoins retraced heavily yesterday, today they are holding above key support levels, signaling potential strength and a possible shift in market dynamics. This resilience across major altcoins could mark a rotation of capital within the market, rather than an exit.
Related Reading
BTC Falls Below Key Support as Volume Spikes
Bitcoin has broken below the tight consolidation range it maintained for over two weeks, with price dropping sharply to a local low of $115,009 before slightly recovering to $115,759. This marks a clear technical breakdown of the horizontal channel between $115,724 and $122,077, as shown in the 4-hour chart. The breach below the lower bound coincided with a spike in volume, signaling decisive selling pressure from market participants.
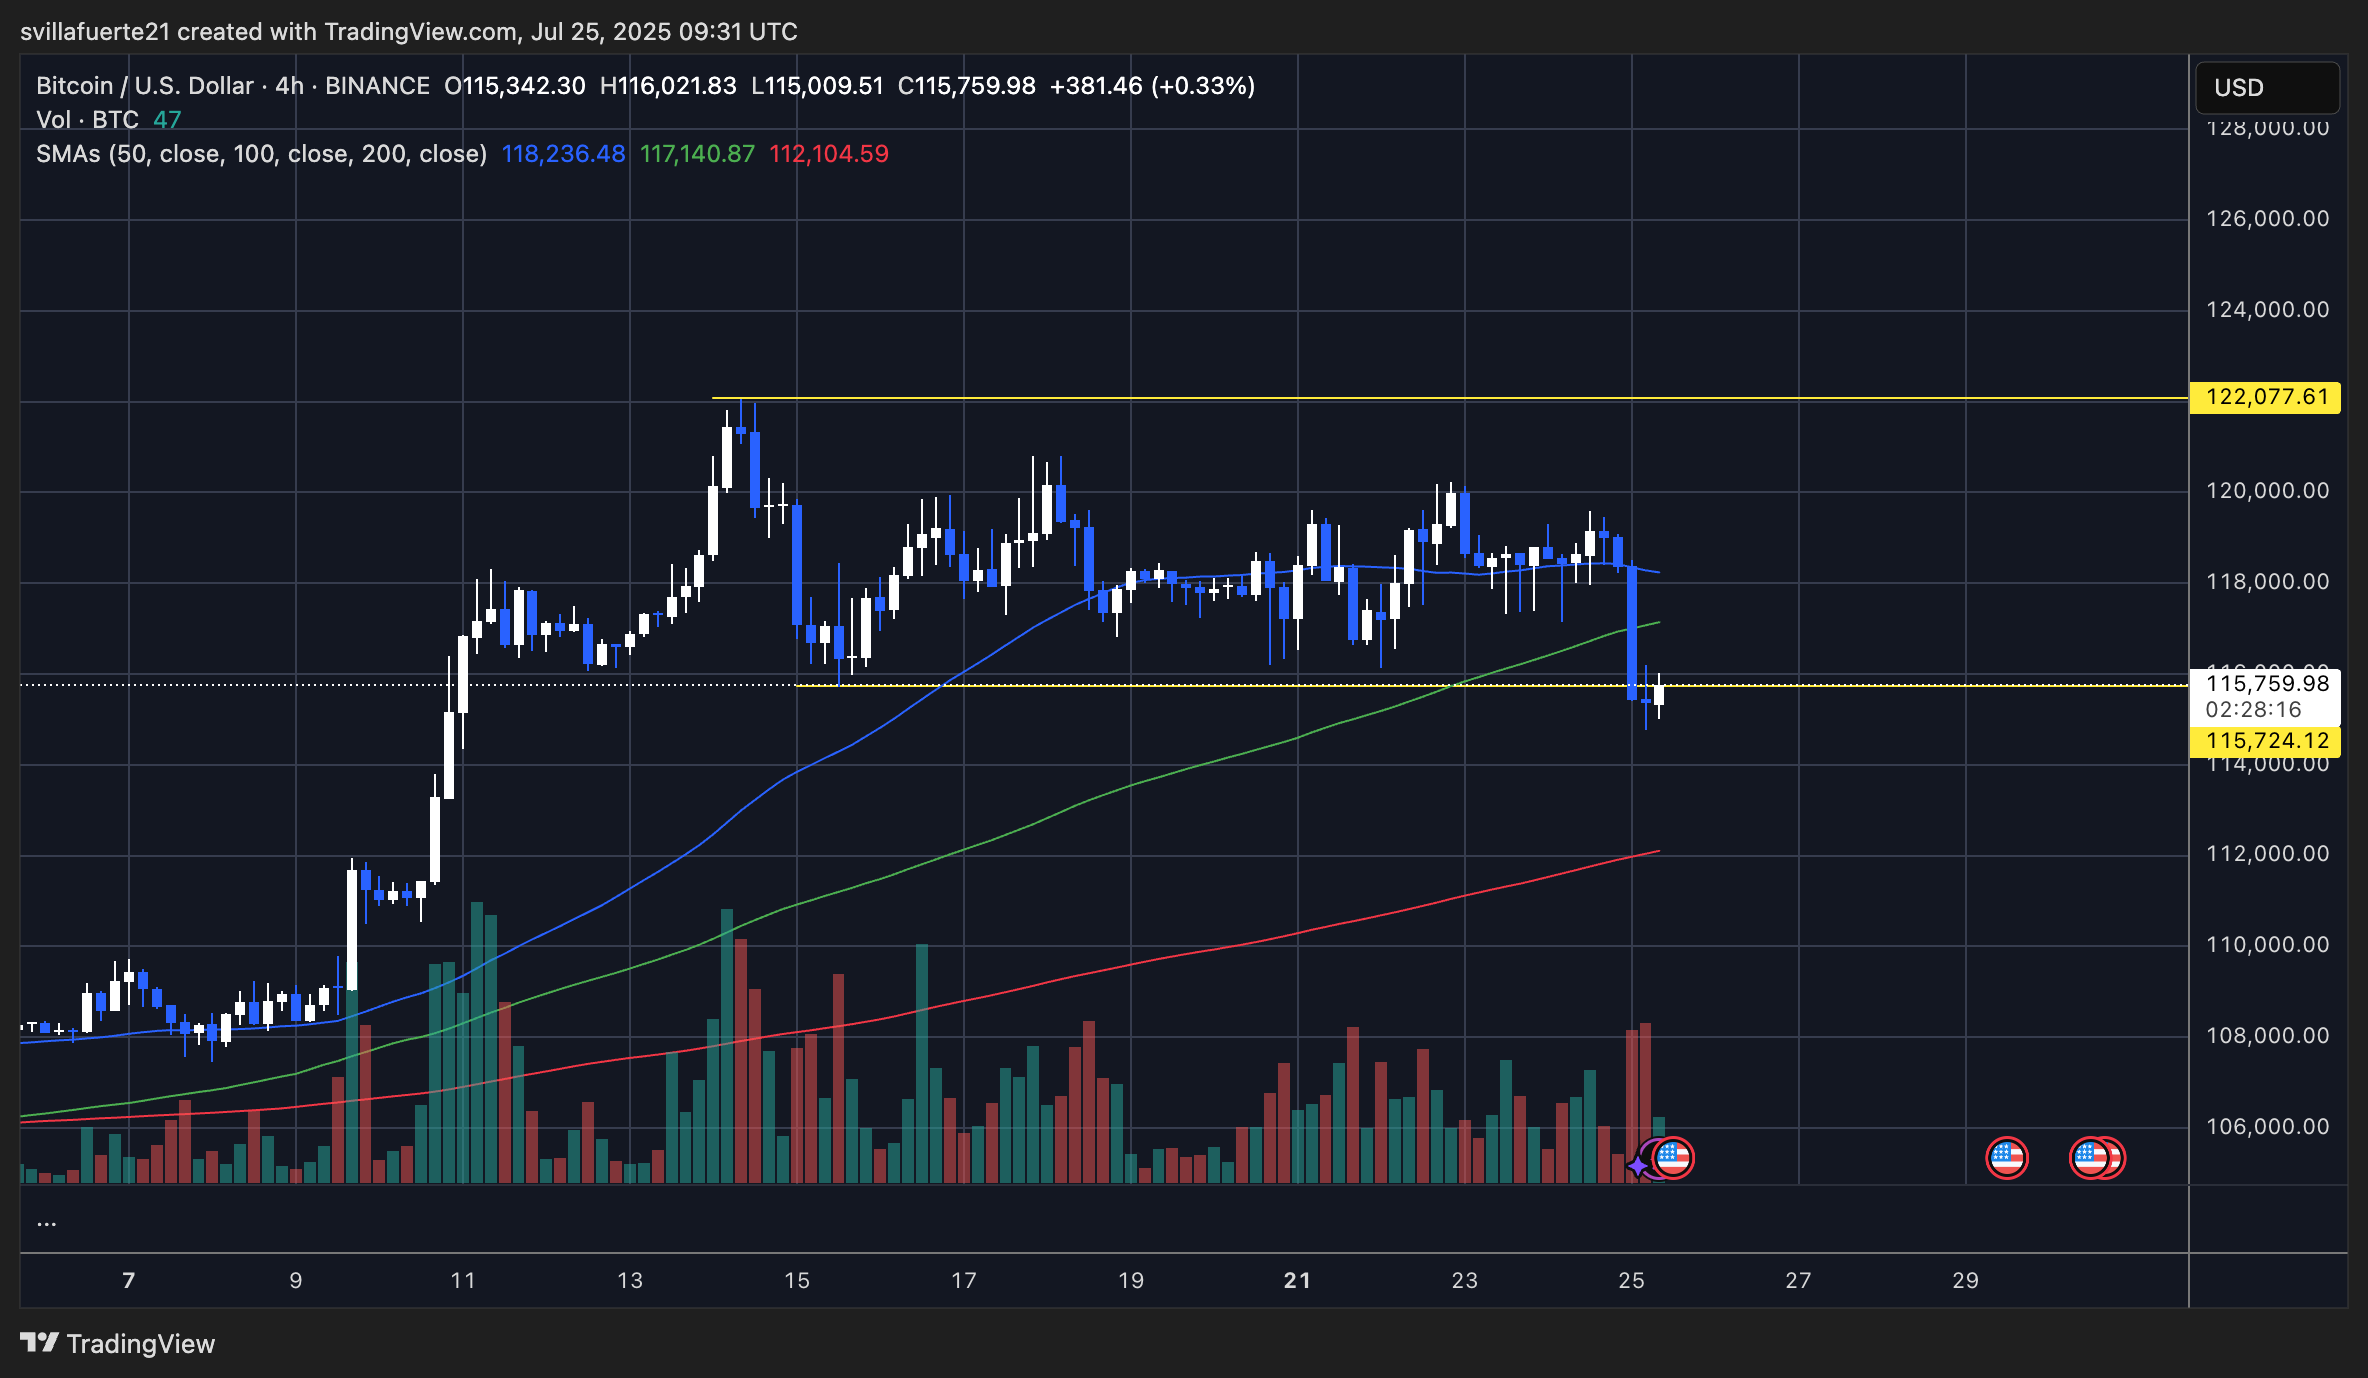
The drop pushed BTC below the 50-day (blue) and 100-day (green) simple moving averages (SMAs), both of which previously acted as dynamic support. The price is now hovering just above the $115,724 horizontal support zone, which is now being retested. A failure to hold this level could open the door to deeper retracements toward the 200-day SMA near $112,104, which could act as the next major support level.
Related Reading
Technically, a bearish structure is developing in the short term, especially after the breakdown from the triangle-like compression (marked in blue). However, the elevated volume accompanying the move may also suggest capitulation from weak hands, which can precede a reversal. In the coming sessions, Bitcoin’s ability to reclaim the $118K level will determine whether bulls can regain control.
Featured image from Dall-E, chart from TradingView
Source link
Sebastian Villafuerte
https://www.newsbtc.com/bitcoin-news/bitcoin-pullback-remains-within-normal-volatility-range-drawdown-analysis-shows-no-signs-of-panic/
2025-07-25 11:00:37